Data Selection MapContact Us
Support
Infrastructure cost modeling, business cases, and deployment insights.
Identifies all location structures where broadband service is or can be installed, including federally defined Broadband Serviceable Locations.
*Source: CostQuest Custom Model
Tracks broadband availability, provider coverage, technology, and service levels at each Broadband Serviceable Location.
*Source: FCC National Broadband Map
Identifies Broadband Serviceable Locations that have received federal broadband funding.
*Source: FCC Broadband Funding Map
Indicates whether a location that falls under an existing federal funding program is covered or uncovered with funding, and with residential or business services using licensed fixed wireless or wired technologies (i.e., Copper, Cable, Fiber to the Premises, Licensed Fixed Wireless, or Licensed-by-Rule Fixed Wireless) with speeds of at least 25/3 Mbps or 100/20 Mbps.
*Sourced from the FCC Broadband Funding Map
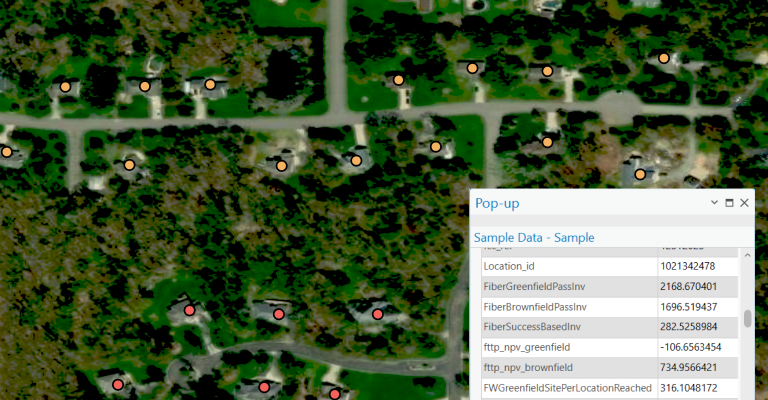
Typical Fiber-to-the-Premises (FTTP) greenfield and brownfield deployment costs and business case, including infrastructure investment, and long-term financial impact.
*Source: CostQuest Custom Model
Provides costs for a typical greenfield and brownfield fixed wireless deployment, including infrastructure investment, and long-term financial impact.
*Source: CostQuest Custom Model
Ranks locations by relative cost of deploying 5G wireless broadband based on geographic and economic factors.
*Source: CostQuest Custom Model
Estimates broadband adoption rates for new fiber providers based on market conditions.
*Source: CostQuest Custom Model
Assesses deployment difficulty for fiber networks based on environmental and infrastructure factors.
*Source: CostQuest Custom Model
Provides structural characteristics relevant for broadband planning and network design.
*Source: CostQuest Custom Model
Identifies Broadband Serviceable Locations at risk of natural disasters that may affect infrastructure resilience.
*Source: FEMA National Risk Index
Provides household and business demographic insights to support broadband planning.
*Source: US Census
Identifies locations that are Community Anchor Institutions.
*Source: CostQuest Custom Model
The Broadband Fabric NetworkPlan Data Suite provides in-depth cost modeling, infrastructure planning, market, and deployment insights, equipping stakeholders with the Data necessary to develop strategic and profitable broadband expansion projects.
Built on CostQuest’s Location and ServiceLandscape Datasets, this suite delivers geospatial broadband service availability at the address level, investment modeling that accounts for deployment costs, engineering variables, and economic feasibility, and demographic and demand indicators that help determine broadband adoption and expansion potential.
Trusted by broadband providers, policymakers, and planners, this Dataset streamlines infrastructure rollouts that yield a positive ROI and optimizes funding applications. Data is available for all U.S. counties, states, and territories.
Identifies all location structures where broadband service is or can be installed, including federally defined Broadband Serviceable Locations.
*Source: CostQuest Custom Model
Tracks broadband availability, provider coverage, technology, and service levels at each Broadband Serviceable Location.
*Source: FCC National Broadband Map
Identifies Broadband Serviceable Locations that have received federal broadband funding.
*Source: FCC Broadband Funding Map
Indicates whether a location that falls under an existing federal funding program is covered or uncovered with funding, and with residential or business services using licensed fixed wireless or wired technologies (i.e., Copper, Cable, Fiber to the Premises, Licensed Fixed Wireless, or Licensed-by-Rule Fixed Wireless) with speeds of at least 25/3 Mbps or 100/20 Mbps.
*Sourced from the FCC Broadband Funding Map
Typical Fiber-to-the-Premises (FTTP) greenfield and brownfield deployment costs and business case, including infrastructure investment, and long-term financial impact.
*Source: CostQuest Custom Model
Provides costs for a typical greenfield and brownfield fixed wireless deployment, including infrastructure investment, and long-term financial impact.
*Source: CostQuest Custom Model
Ranks locations by relative cost of deploying 5G wireless broadband based on geographic and economic factors.
*Source: CostQuest Custom Model
Estimates broadband adoption rates for new fiber providers based on market conditions.
*Source: CostQuest Custom Model
Assesses deployment difficulty for fiber networks based on environmental and infrastructure factors.
*Source: CostQuest Custom Model
Provides structural characteristics relevant for broadband planning and network design.
*Source: CostQuest Custom Model
Identifies Broadband Serviceable Locations at risk of natural disasters that may affect infrastructure resilience.
*Source: FEMA National Risk Index
Provides household and business demographic insights to support broadband planning.
*Source: US Census
Identifies locations that are Community Anchor Institutions.
*Source: CostQuest Custom Model